Did you ever ask what really contributes to the Moodle reporting? That is to ask, what are the basic things that you need to familiarize so as to expand your understanding to know that you know about Moodle reporting and dashboards?
In this post, we will explain about the basic stuff that holistically contributes to (or helps to have Moodle reports) the Moodle learning analytics individually.
#1 Dashboard
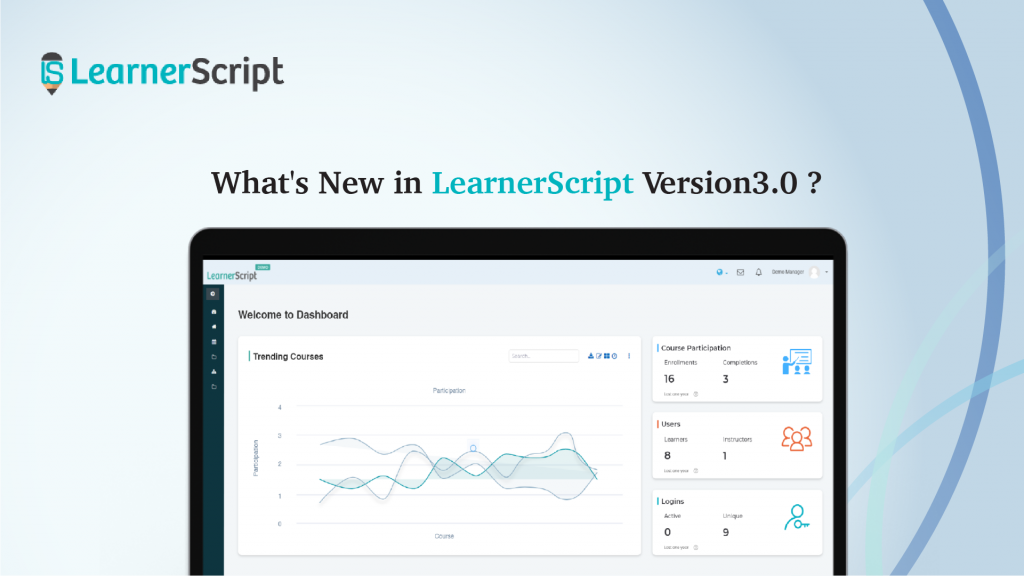
The dashboard is the place where you get to see all the information when you log in to the analytics tool. It’s just like the dashboard you will see on your vehicle where you will be able to know all the information.
However, plain Moodle LMS doesn’t offer any such thing as a dashboard.
But you can get the information from reports from the administration. In fact, they aren’t the reports but a table of information.
You will have reports like course-level one where you can the information on a particular course. Nothing else! You can’t even compare various courses. And if you want to view reports of other modules such as Quizzes, Graded, Activities, and so on you have to browse to the respective page.
So there is no question of switching from one dashboard of role to the other of a different role. And you won’t lose anything since the plain Moodle LMS is an absolute freebie!
#2 Charts & Graphs
Charts and graphs help beautifully visualize your users’ data and courses and draw decisive insights from them. However, you won’t see them from a plain Moodle reporting and analytics except – bar charts and some cases pie charts.
And there are some tools in the market which provide various charts and graphs for the apt presentation of the data; graphs such as combination graphs help you draw more insights from one report.
Again, you can’t expect these advanced analytics features from a freebie.
#3 Timeline
So you want to see the analytics for so and so period? What will you do? You have to use a filter, don’t you? Timeline is a kind of filter that helps you showcase the analytics for custom dates, week, month, and year.
If you want to see the data for a particular month, you can, by selecting that month. And usually, you will have this timeline filter on the dashboard for each role of Moodle LMS.
#4 Filters
Filters come along way. For instance, a course filter helps you get the course you are looking for. And accordingly, you can see the reports of that course displayed on the dashboard.
In the plain Moodle reporting, the filter options are relatively a few. For instance, in Activity-level report you have – view and post activity, but not submit the activity.
And there may be instances where you may need a few more filters for quick search results.
#5 Scheduling
Scheduling can be one of the prominent features of Moodle reporting, which is not there in the plain one. However, some tools in the market provide it.
The importance of this feature is that you can schedule reports for a custom day of a week/date of a month to automate the Moodle reports so that your learners need not log in to the system each time.
The feature provides great flexibility both for Moodle admin and their learners, doesn’t it?
#6 Permissions
Permissions allow who (the role based on the Moodle contextual role) to have access to your Moodle reports for what period. Thus, the feature helps you protect your sensitive analytics from reaching to the unintended persons.
The advanced feature aims to keep your Moodle analytics safe and secure.
Conclusion
That’s all with the basic stuff concerning the Moodle reporting. Simple features that help you go along way with the Moodle platform. There are additional and advanced features in some Moodle analytics tools in the market to help have better Moodle analytics.
Plus, you can use various reporting plugins from Moodle plugins section to custom the plain Moodle reporting. That way you can have Moodle analytics at cost-free.

