

Dashboard
On LearnerScript, you’ll have customizable, multiple, role-wise, Moodle reporting dashboards. Add a new Moodle dashboard, if needed.
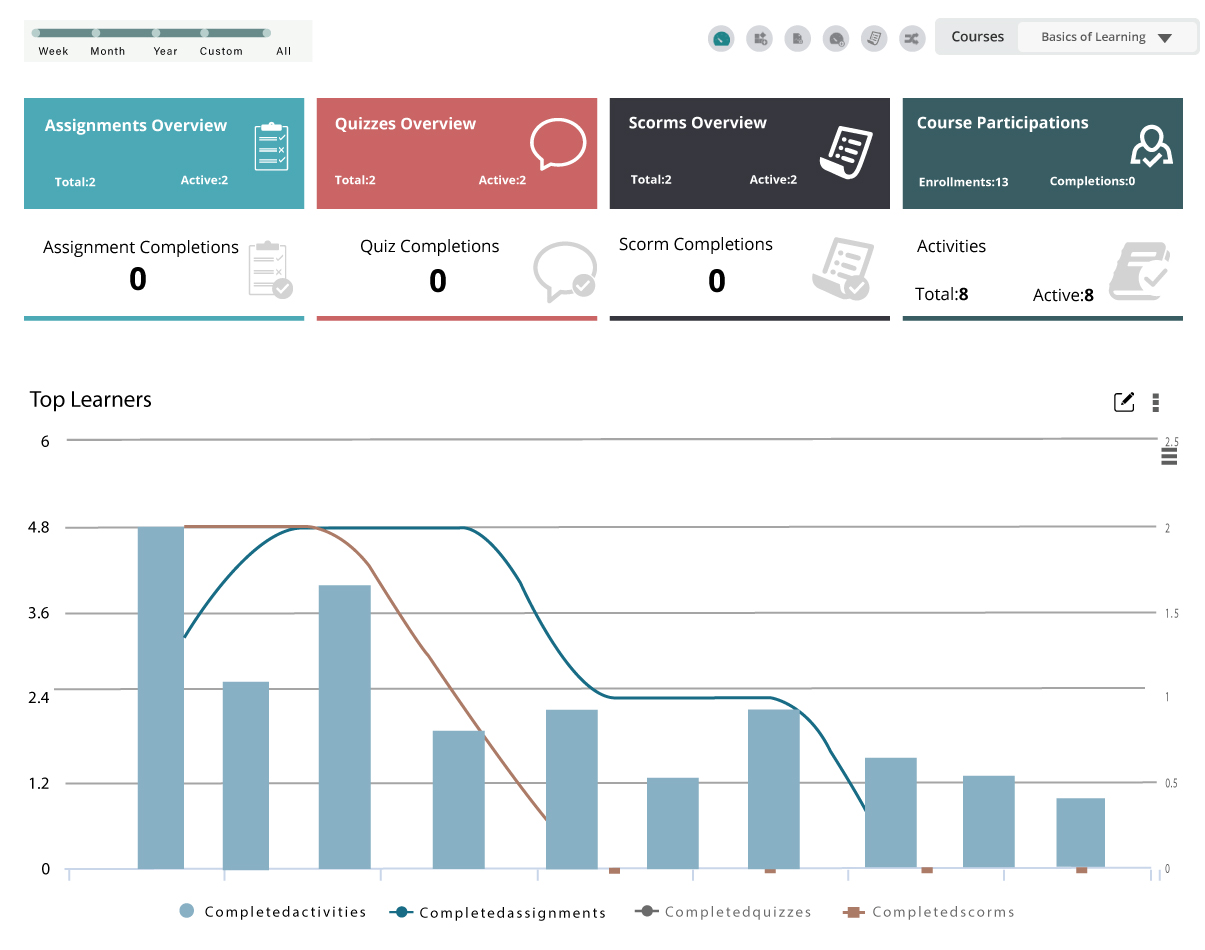
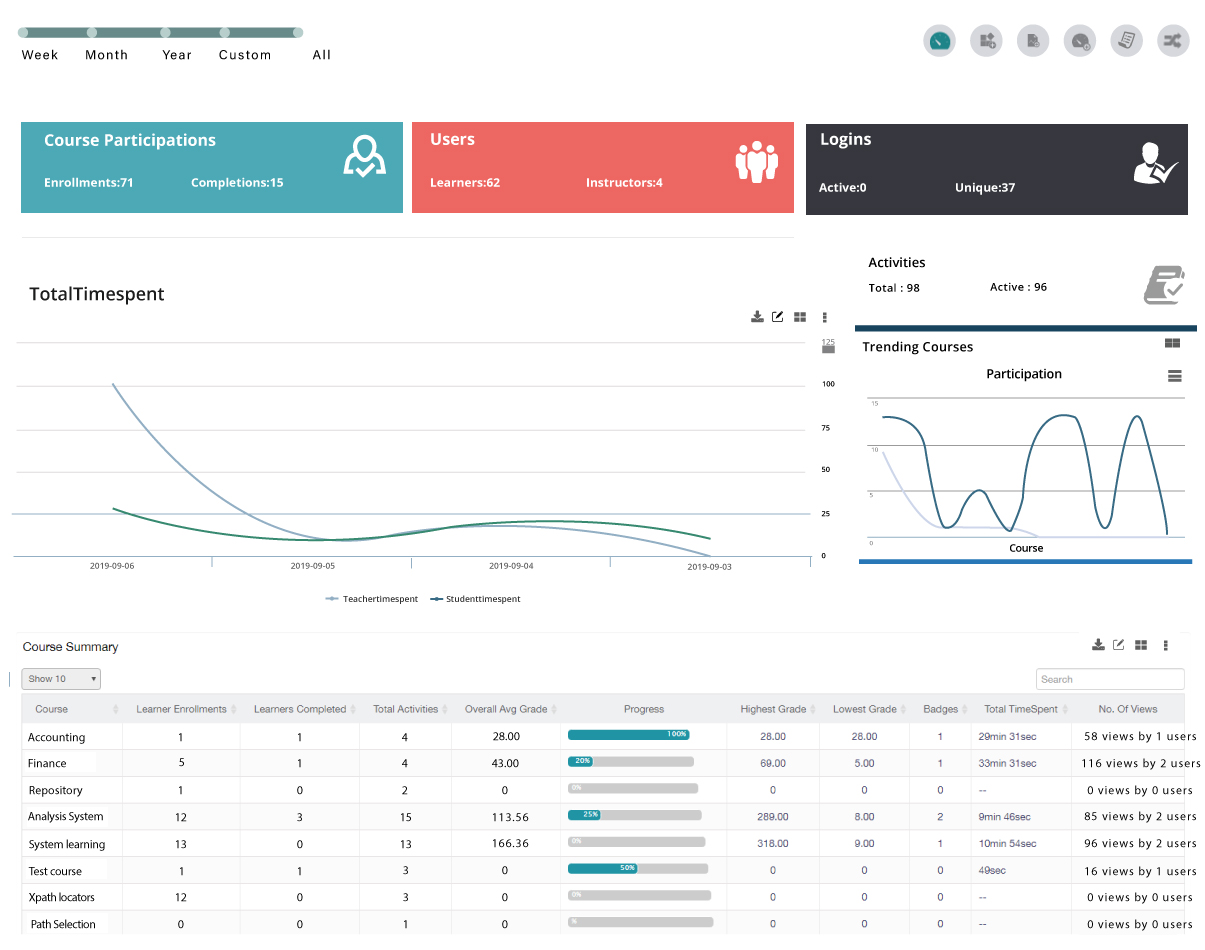
Course
Have a role-wise Moodle course dashboard for analytics. Depending on role, get the respective analytics. Also, get site-wide reports from here.
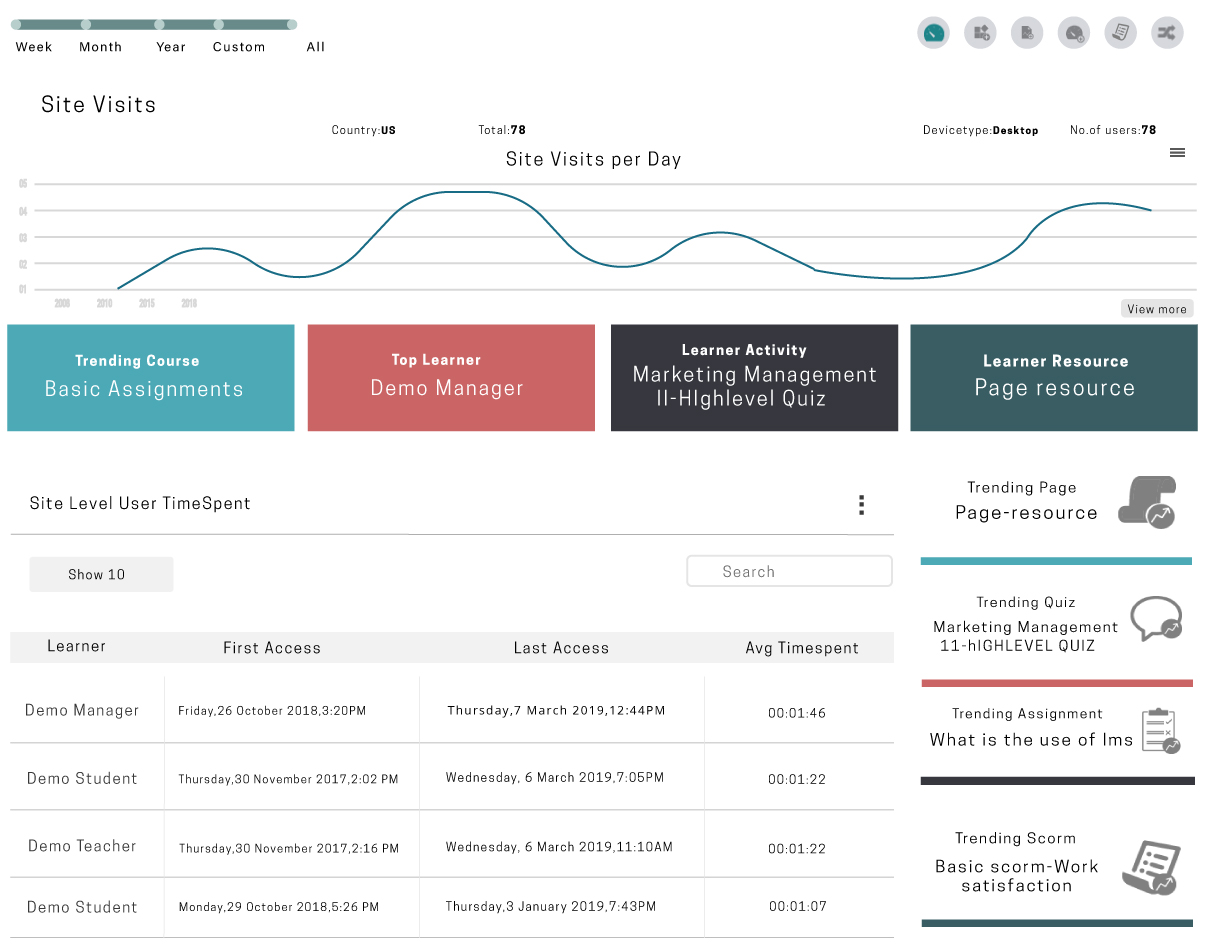
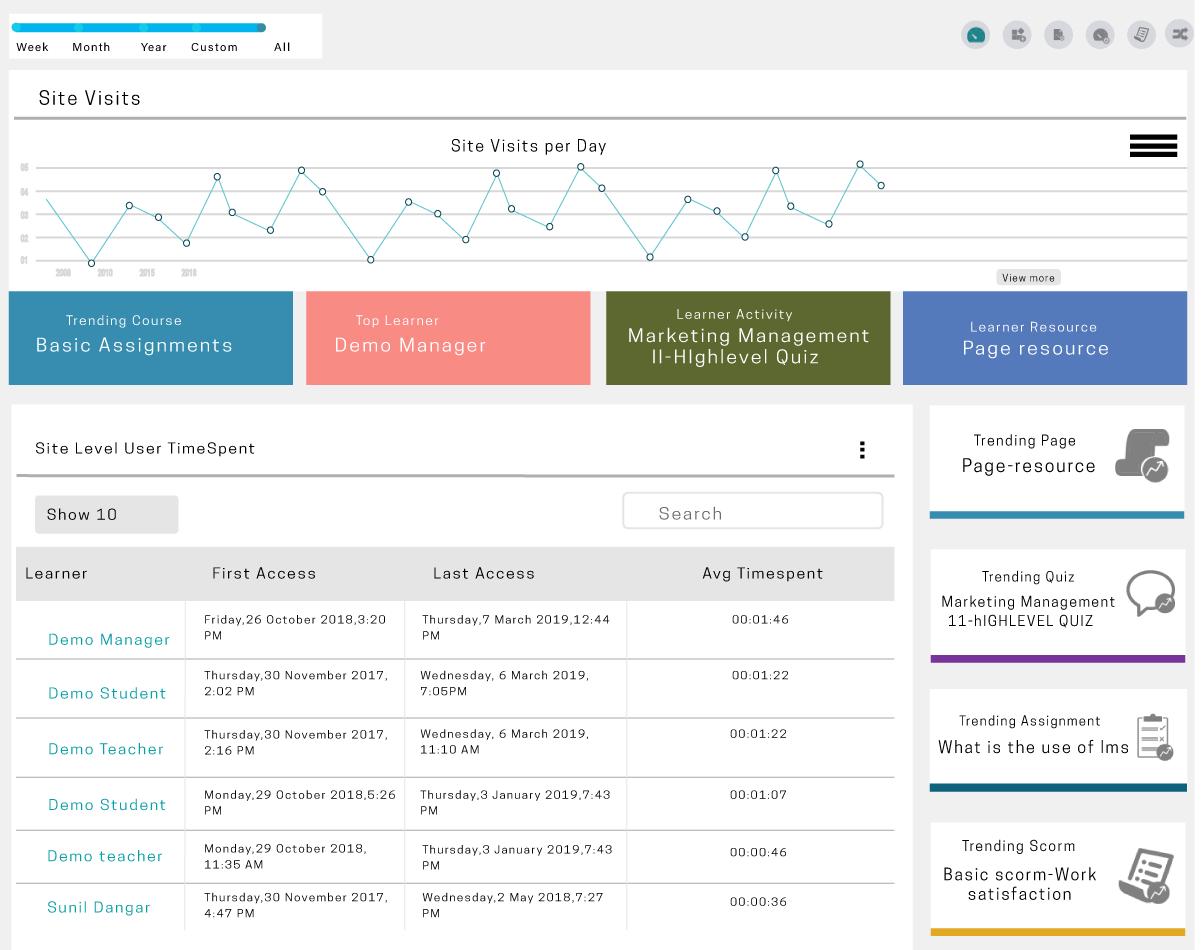
Timespent
Get daily Site Visitor Count, No. of Views per page, Average Time-spent per page per learner, the Total Time-spent on each page reports, etc.
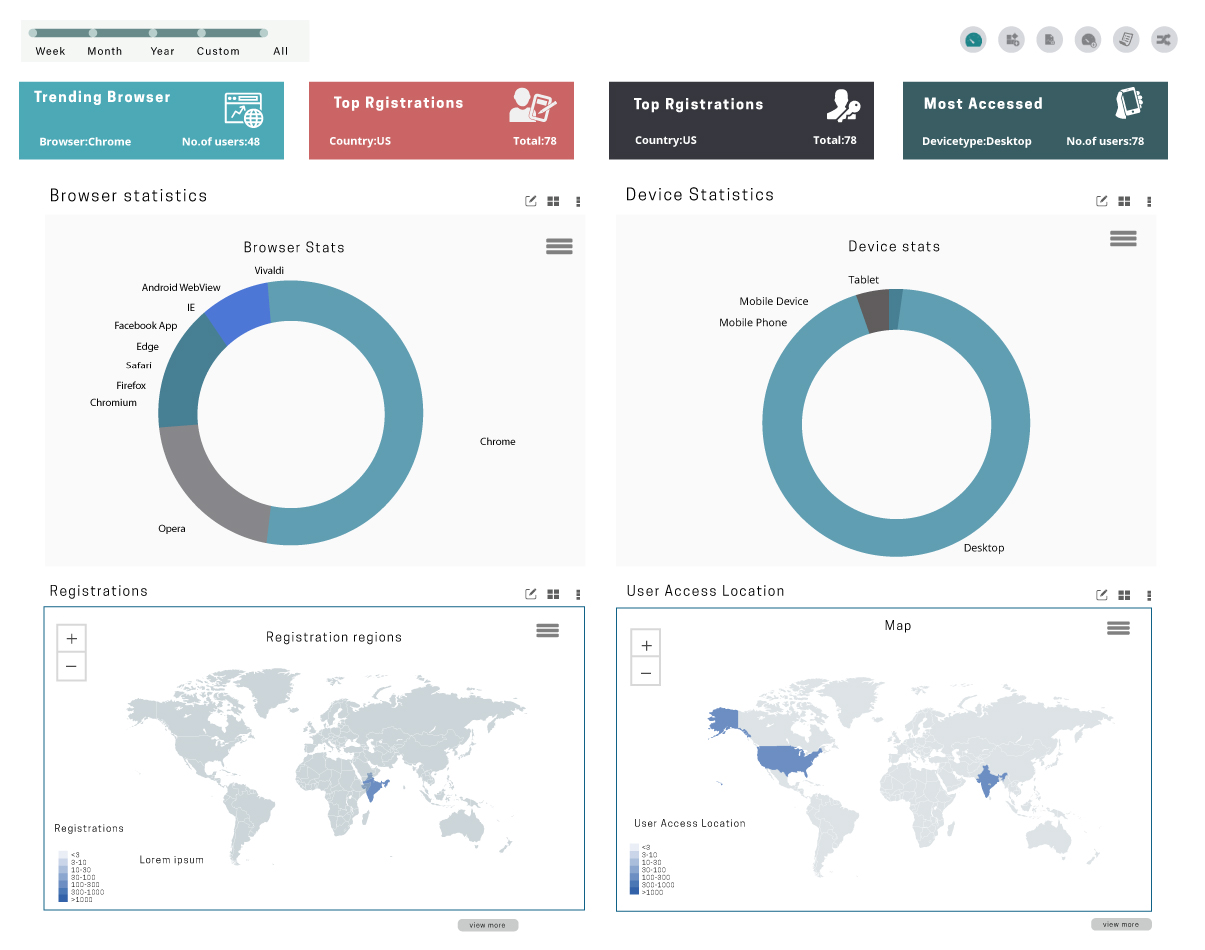
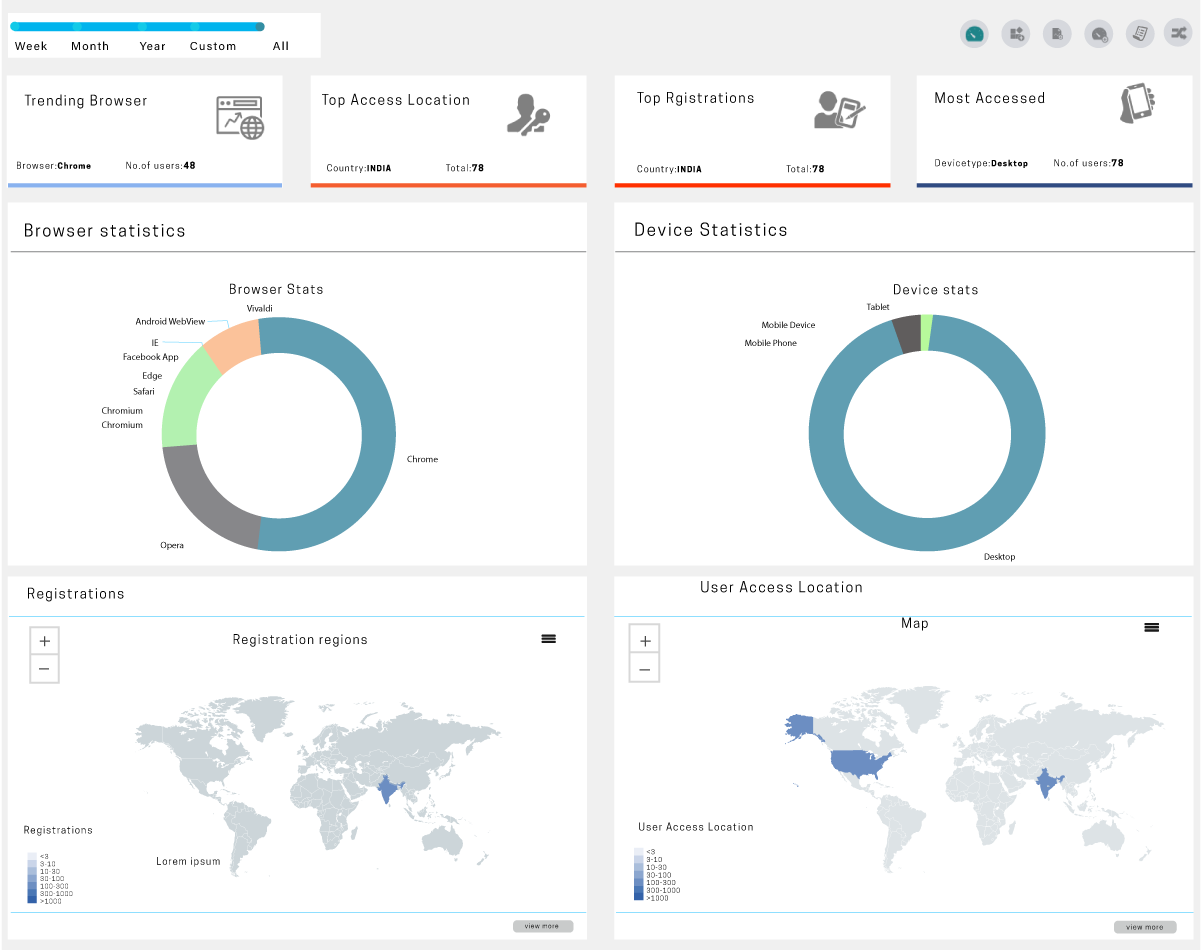
Geographical
Get the Moodle insights like Browser Statistics, User Access Location, Device Statistics, Registration, Most Accessed Location, etc.
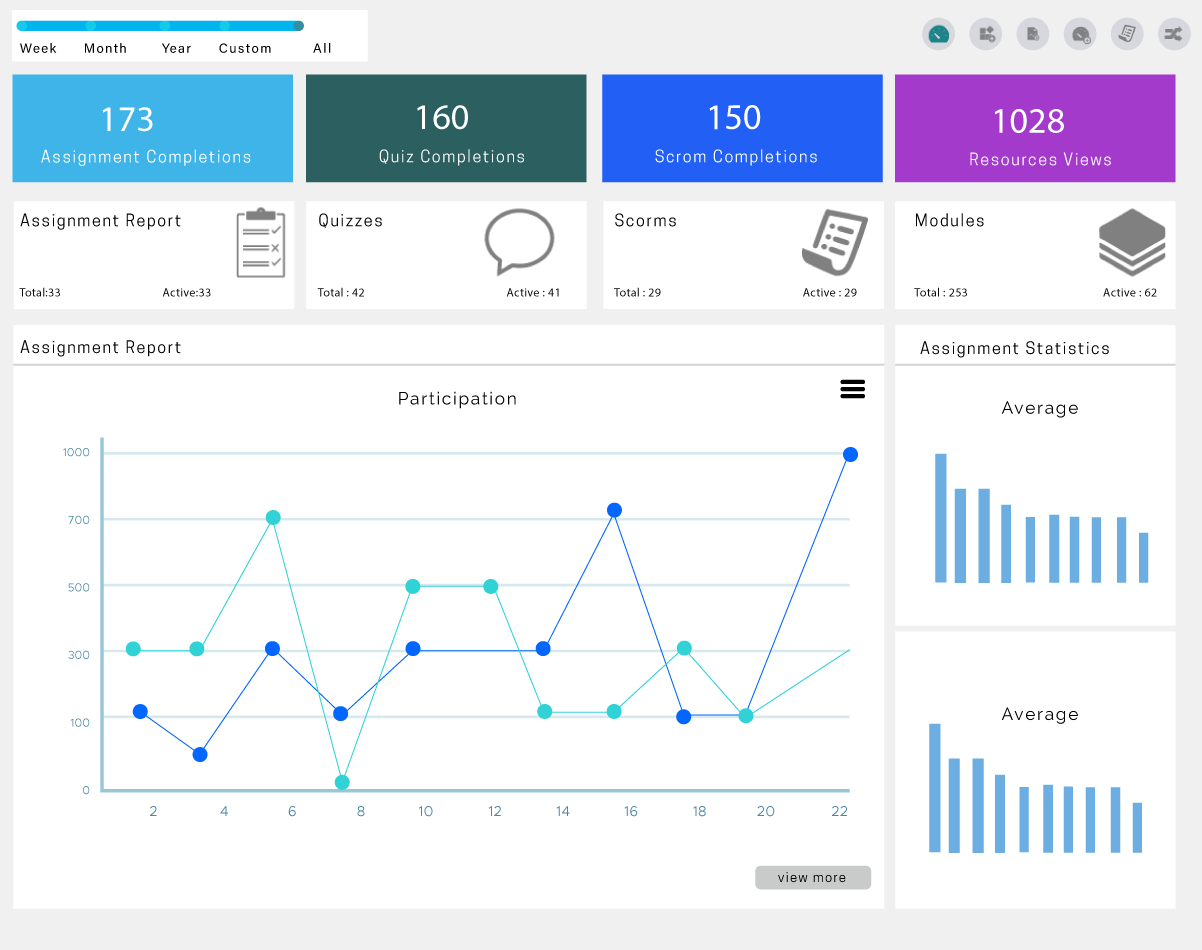
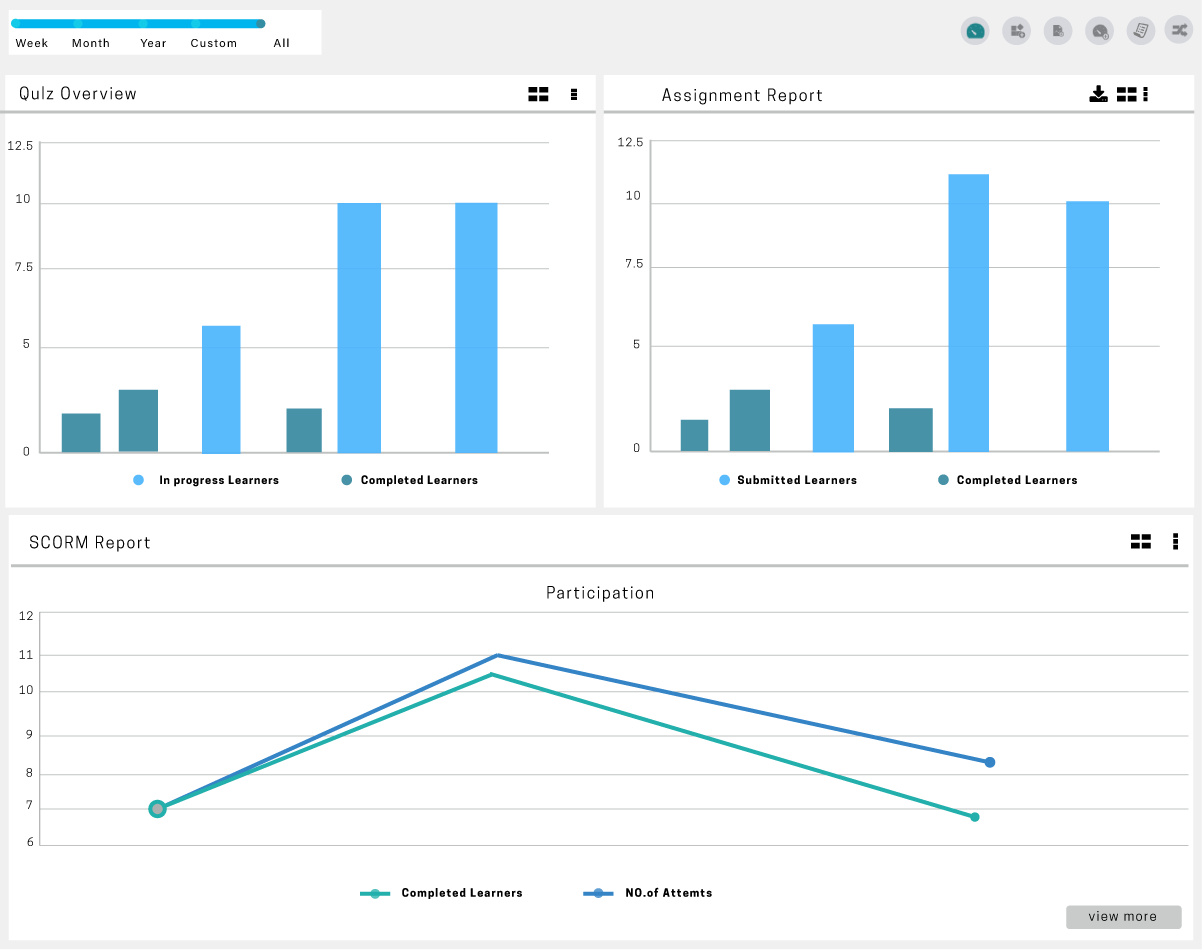
Instructor
Course Instructor will have her own dashboards a/index.php/contact/nd the reports only related to her courses, assignments, quizzes, SCORMs, etc.
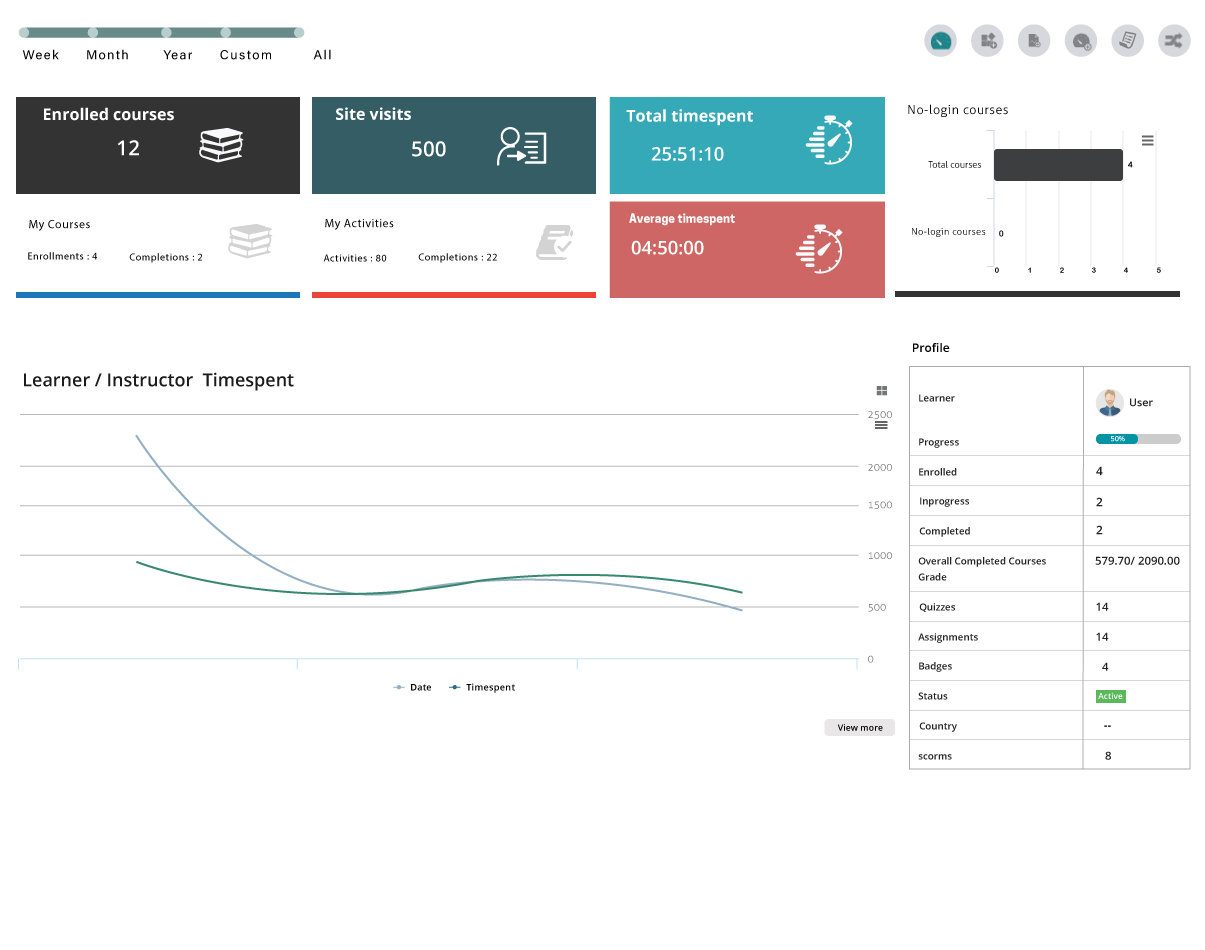
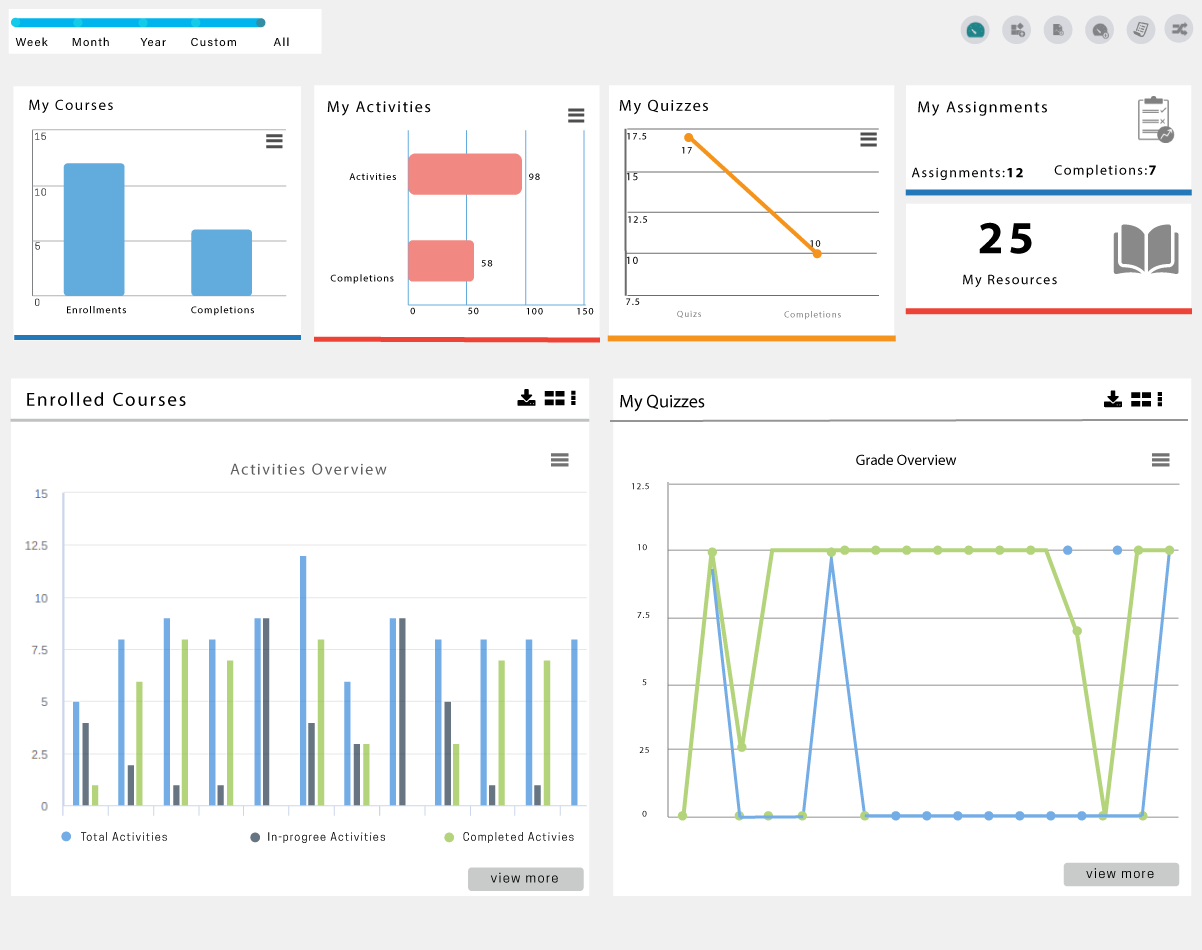
Student
Like instructor, a learner too will have their own dashboards with completion reports of courses, assignments, quizzes, SCORMs, etc.
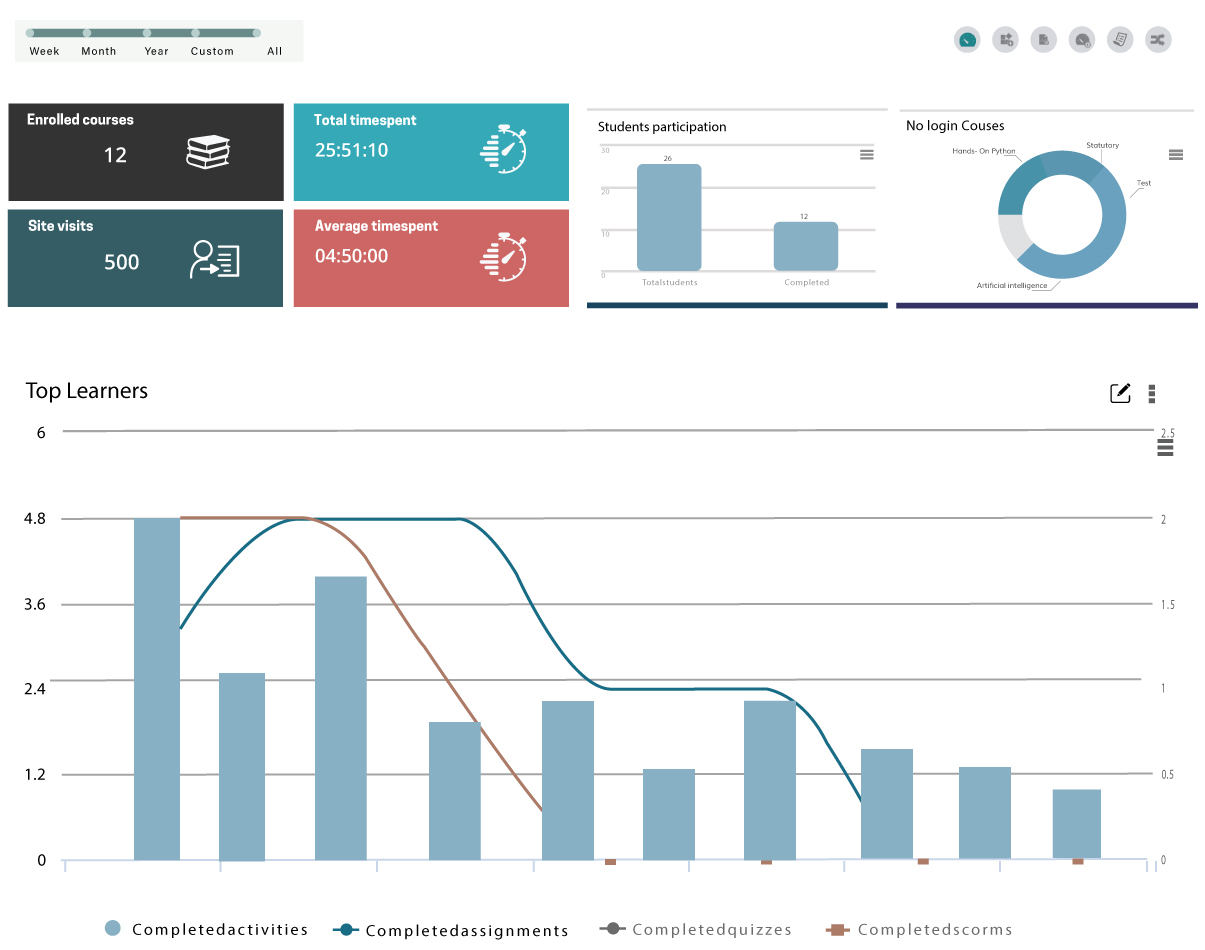
On LearnerScript, you’ll have customizable, multiple, role-wise, Moodle reporting dashboards. Add a new Moodle dashboard, if needed.
Have a role-wise Moodle course dashboard for analytics. Depending on role, get the respective analytics. Also, get site-wide reports from here.
Get daily Site Visitor Count, No. of Views per page, Average Time-spent per page per learner, the Total Time-spent on each page reports, etc.
Get the Moodle insights like Browser Statistics, User Access Location, Device Statistics, Registration, Most Accessed Location, etc.
Course Instructor will have her own dashboards and the reports only related to her courses, assignments, quizzes, SCORMs, etc.
Like instructor, a learner too will have their own dashboards with completion reports of courses, assignments, quizzes, SCORMs, etc.
Design a Moodle custom report superfast, all in a single page
- Select dataset and drag & drop datapoints to design a report
- Add conditions, calculations and filters that aptly convey your data
- Enable required download formats
- Preview design whether it’s up to your mark
- Create unlimited, useful reports
Your LMS report is now a smart Widget with LearnerScript
- When your LMS report is designed as a block, it becomes a widget
- You can then place your report on the dashboard or outside it
- A widget is a page pertinent. Depending on a page you enable it, a widget showcases that page data only
- All Canned Reports from LearnerScript are available as widgets
- You can design your Moodle custom reports as smart widget
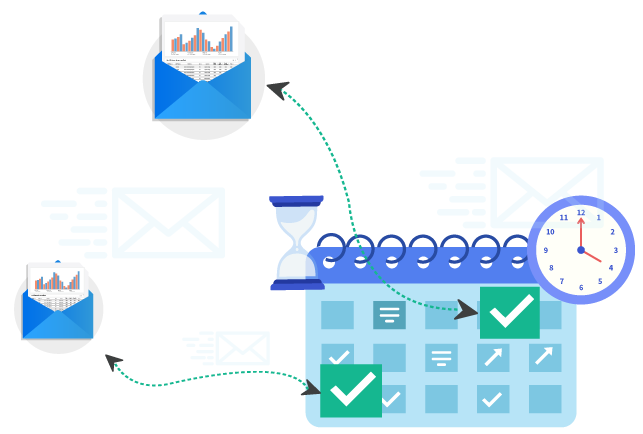
Schedule your Moodle report for a slated release
- You no need to login to view every LMS report every time. Just schedule them once & get it and see directly from your inbox
- Schedule your LMS reports for a – daily, weekly or monthly
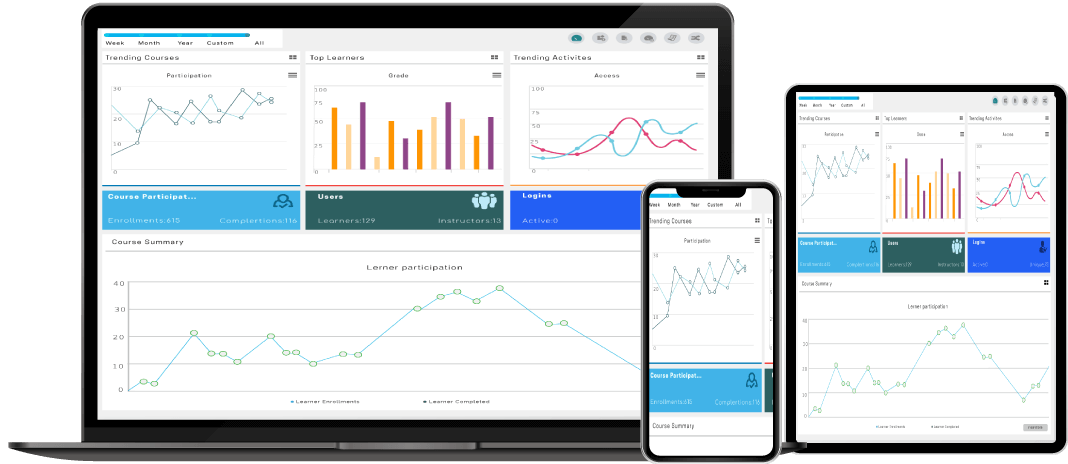
Any device, but one reporting tool
Download Formats
Download your report as an image – JPG, JPEG, SVG or print it. Or export the same in formats such as PDF, XLS, etc. depending on your requirement
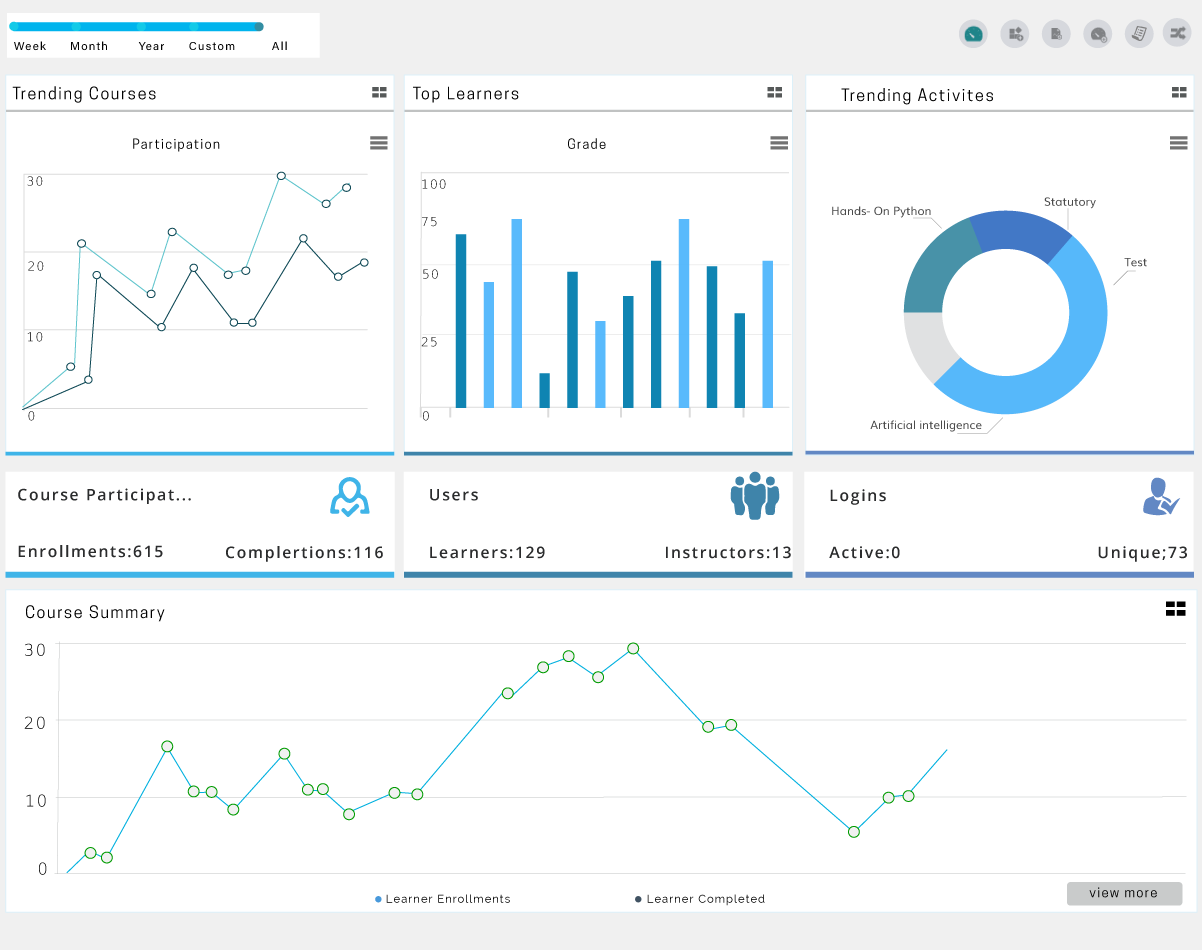
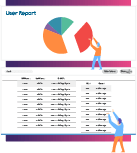
Course Profile
Similar to User Profile, Course Profile summarizes all your courses-related activities like – top trending courses, no. of course enrollments, course status, etc. Use comparative analysis of courses to know which course is doing well.

Switch Dashboards
Switch between your Moodle reporting dashboards with ease – course, geographical, timespent or any of your custom Moodle dashboards.
Add widget/tile/report/new dashboard
Add a new widget, tile, report or Moodle custom dashboard without breaking the bank. Do add them, absolutely based on your requirement.
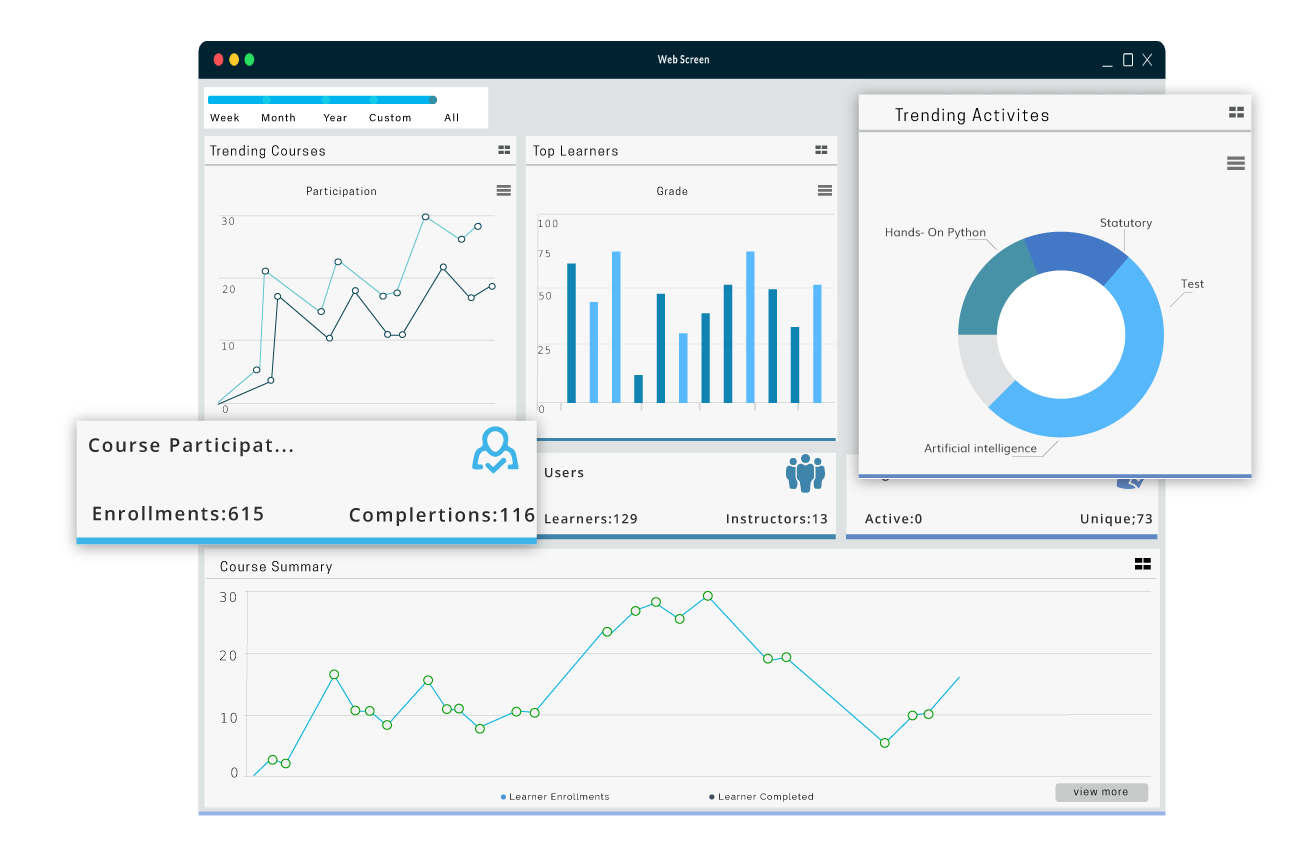
Graphs, Charts & Tables
Analyze and visualize your Moodle LMS data in the forms of various graphs, charts and tables, for actionable insights.

Instant Communication
Communicate with your peers/students with instant messaging and give alerts with instant notifications. And email a particular report to a particular role.
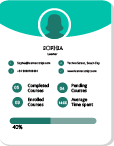
User Profile
With User Profile, get summary of all your learning activities like Enrolled, In-progress, Completed courses, etc. Drill-down for further insights. To see who is good at what, make comparative analysis with peers.

Timeline
Analyze your Moodle LMS reports over a time period with Timeline facility which summarizes Moodle data for a – week, month, year or custom dates.

Switch Roles
Without going here and there, you can switch between the roles, if you play multiple roles. In which role you may be in, you’ll see only that role-related dashboards.
Canned Reports
Learnerscript comes with readily available 80plus Canned Reports. You can make the most of them unless you need a completely new Moodle custom report.
You are a step away from a wealth of insights